How Many Workers Die of Heat Stress Each Year? The 2026 Data
1. The Headline Number: How Many U.S. Workers Die of Heat Stress Each Year?
According to the U.S. Bureau of Labor Statistics’ Census of Fatal Occupational Injuries (CFOI), an average of 39 workers per year have died from exposure to environmental heat over the most recent decade of finalized data (2014–2023).1 The annual count fluctuates with weather — 56 deaths in 2021, the year of the Pacific Northwest heat dome, and 47 in 2023, the most recent finalized year released by BLS in late 2025.2
Cumulatively, BLS has recorded just under 470 heat-related occupational fatalities since 2011. That is the official number safety leaders, regulators, and journalists cite. It is also almost certainly too low.
Why the BLS Number Is the Floor, Not the Ceiling
CFOI counts a death as heat-related only when “exposure to environmental heat” is identified as the primary cause on the death certificate or investigation record. Heat is rarely the line item on a death certificate. A worker who collapses from a heat-induced cardiac event is typically coded as a cardiovascular death. A worker who falls from a roof because heat impaired their judgment is coded as a fall. A worker who succumbs hours later in the hospital is often coded under whatever organ failure ultimately ended their life.
The BLS line item captures the unambiguous cases. The actual death toll lives beneath it.
2. The Iceberg Beneath the Headline: What the BLS Number Misses
A 2021 analysis by Public Citizen, drawing on academic research and on data BLS itself has acknowledged is incomplete, estimated that the true number of heat-related occupational deaths in the United States is likely between 600 and 2,000 per year — roughly 17 to 50 times the BLS figure.3 Independent peer-reviewed work has reached similar conclusions: the heat signal in worker mortality is real, large, and consistently undercounted in the federal data.4
Three Reasons the Real Number Is Hidden
- Cause-of-death coding. Heat triggers the failure mode (cardiac event, stroke, organ failure) but is not itself recorded as the cause of death.
- Time-lag deaths. Workers who collapse on a jobsite and die in a hospital hours or days later often fall outside the on-the-job fatality count.
- Reporting fear and informal labor. Day laborers, contract workers, and undocumented workers are statistically underreported across every category of occupational injury, and heat fatalities are no exception.
The Public Citizen estimate — 600 to 2,000 deaths per year — is the best available picture of the real toll, and it is the number safety leaders should plan against, not the BLS line item.
Heat Illness Below the Fatality Line
For every fatal heat exposure, BLS counts roughly 80 to 100 nonfatal heat-related occupational injuries and illnesses serious enough to require time off work — about 3,400 cases per year on average between 2011 and 2020.5 Independent surveys consistently find that even this number captures only a small share of the actual heat-illness incidents on U.S. jobsites; the great majority of heat exhaustion cases never reach a clinic, and so never reach a federal data set.
3. Heat-Related Worker Deaths by Industry: Where the Risk Concentrates
Heat fatalities are not distributed evenly across the U.S. workforce. They concentrate sharply in a handful of industries that share three characteristics: outdoor or uncooled work environments, sustained physical exertion, and limited control over scheduling.
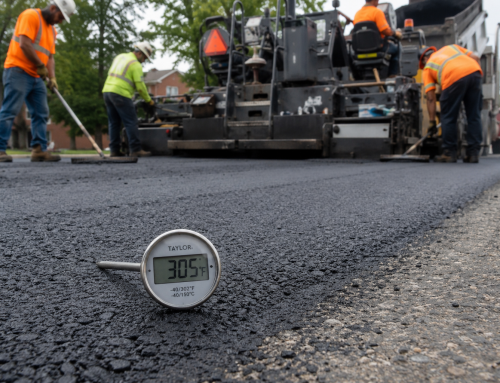
Construction — Largest Absolute Share
Construction accounts for the largest single share of heat-related occupational fatalities in the BLS data — roughly one in three recorded heat deaths.1 Heavy civil, roofing, and concrete work are particularly exposed: roofers work directly on a heat-absorbing surface, civil crews on long-duration projects in regions where summer WBGT routinely exceeds OSHA’s high-heat trigger, and concrete crews in conditions where pour schedules cannot easily move to cooler hours.
Agriculture — Highest Rate per 100,000 Workers
Agricultural workers die from heat exposure at a rate roughly 35 times the rate of the broader U.S. workforce.6 Crop production — field labor, harvest crews, and orchard work — carries the highest fatality rate inside agriculture. The combination of full-sun exposure, piecework pay structures that disincentivize breaks, and a workforce that is disproportionately migrant and reluctant to report illness creates a near-perfect set of risk factors.
Oil & Gas Operations
Heat fatalities in upstream and midstream oil & gas have risen alongside basin development in Texas, New Mexico, and Oklahoma. Crews working in flame-resistant clothing (FRC) carry an additional thermal burden of 5–15°F over equivalent work in standard clothing — meaning a 95°F field day can put a worker in FRC at an effective core thermal load equivalent to 105°F or more.7
Postal and Last-Mile Delivery
Heat-related fatalities among postal carriers and last-mile delivery drivers have drawn high-profile OSHA enforcement actions in recent years, particularly involving USPS and large parcel carriers in the South and Southwest. Vehicle cabs without functioning A/C, walking routes in full sun, and uniform requirements that prevent heat dissipation all contribute.
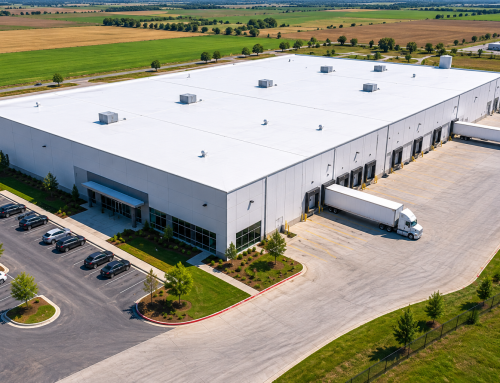
Warehouse and Distribution
As e-commerce volumes have grown, so has the share of heat incidents inside non-climate-controlled warehouses. Indoor heat is often worse than outdoor heat: a metal-roofed warehouse on a 95°F afternoon can run 110°F+ at the work surface, with no breeze and no shade.
Other High-Exposure Sectors
- Refuse and recycling collection — high physical exertion, full-day route exposure
- Mining and quarrying — surface and underground heat load
- Utilities and lineworker storm response — extreme exertion, FRC, irregular hours
- Emergency response (wildland fire, tactical) — full PPE plus radiant heat exposure
- Manufacturing — process heat compounded by ambient summer load
4. Heat-Related Worker Deaths by State: Where the Map Heats Up
By absolute fatality count, four states consistently lead the BLS data: Texas, California, Florida, and Arizona. Together they account for the majority of recorded heat-related occupational deaths in any given recent year.1
Texas
Texas typically records the largest number of heat-related occupational deaths in the country, reflecting the combined size of its construction, oil & gas, and agricultural sectors and a long, severe heat season. Texas has no statewide heat-illness prevention standard for outdoor workers, and a 2023 state law preempted the local heat ordinances Austin and Dallas had passed.
California
California carries large absolute fatality numbers because of the size of its workforce, but its per-worker fatality rate is lower than Texas — a fact most often credited to Cal/OSHA’s heat illness prevention standard (Title 8 §3395), which has been in effect for outdoor workers since 2005 and was extended to indoor workers in 2024.
Florida
Florida reports high heat-related death counts driven primarily by agriculture, construction, and landscaping. Like Texas, Florida has no state heat standard, and a 2024 state law similarly blocked local jurisdictions from enacting their own.
Arizona
Arizona’s per-worker heat fatality rate ranks among the highest in the country. Phoenix routinely records 100+ days per year above 100°F, and the construction and warehousing sectors driving the metro’s growth operate through that heat season.
The States With Active Heat-Illness Standards
As of 2026, the states with active outdoor or indoor heat-illness prevention standards are California, Washington, Oregon, Minnesota, Maryland, Colorado, and Nevada. The federal proposed rule from OSHA, advanced through public comment in 2024 and currently in final-rule review, would bring a baseline national standard to the remaining 43 states.
5. The Trend Line: Are Heat Deaths Rising, Falling, or Holding?
The BLS series, viewed across the past two decades, shows two clear patterns:
- A noisy upward drift in absolute counts since the early 2010s, consistent with rising summer temperatures and lengthening heat seasons in heat-exposed regions.
- A sharp single-year spike in 2021 driven by the Pacific Northwest heat dome, when 56 workers died — the highest annual count in the modern series. Subsequent years (2022 and 2023) returned closer to but still above the long-run average.
Climate projections from NOAA, NIOSH, and the U.S. Global Change Research Program all point to longer, hotter summers across the Sunbelt, the Midwest, and increasingly the Pacific Northwest through 2030. Without a meaningful change in how worker heat exposure is managed, the BLS line is more likely to climb than to flatten.
OSHA’s Heat National Emphasis Program (NEP)
Launched in April 2022 and renewed and expanded in 2025, OSHA’s Heat NEP has produced more than 6,000 heat-related inspections and millions of dollars in proposed penalties.8 The NEP is the strongest enforcement signal employers have received on heat illness in U.S. occupational-safety history. It is also, by OSHA’s own published guidance, a stopgap pending the final federal heat standard.
6. Heat Exhaustion and Productivity Loss: The Cost Below the Fatality Line
Heat fatalities are the visible peak. The far larger economic and human cost lives in nonfatal heat illness and lost productivity — both of which scale with the same conditions that produce the deaths.
The Productivity Number
A 2021 analysis from the Atlantic Council’s Adrienne Arsht-Rockefeller Foundation Resilience Center estimated that extreme heat costs the U.S. economy roughly $100 billion annually in lost labor productivity.9 The same analysis projected that figure rising to $200 billion or more by 2030 and approaching $500 billion by 2050 under current trajectories. More recent peer-reviewed work has refined and largely confirmed the magnitude.10
What That Looks Like at the Crew Level
Productivity loss from heat shows up in three patterns on a single jobsite:
- Slowdown. Crews working at WBGT above OSHA’s moderate threshold complete tasks measurably slower — not because they are choosing to, but because human muscle output declines as core body temperature rises.
- Unscheduled breaks. Workers self-pace into the shade, into vehicles, or into any cooler space they can find. These breaks are not on the project schedule and are not in the labor budget.
- Rotation gaps. When a crew rotates out a worker who is overheating, the project loses both that worker’s hours and the cycle time of pulling them out, cooling them, and getting them back — if they come back at all that shift.
Most operations don’t measure these costs directly — they feel them in missed milestones and tightening summer margins. Managers who do measure them typically find the productivity loss alone exceeds the cost of the engineering controls that would prevent it.
7. What Actually Moves the Number: Engineering Controls vs. Administrative Controls
OSHA’s three pillars of heat illness prevention — water, rest, shade — are administrative controls. They depend on a worker recognizing heat strain, a supervisor enforcing breaks, and an environment that allows the recommended behavior. Administrative controls are necessary, mandated, and insufficient by themselves to bring the fatality number down meaningfully.
The Hierarchy of Controls Applied to Heat
NIOSH’s hierarchy of controls ranks safety interventions from most to least effective: elimination, substitution, engineering controls, administrative controls, and personal protective equipment.11 Heat illness prevention has spent two decades concentrated at the bottom three rungs — PPE (cooling vests), administrative (water/rest/shade), and modest substitution (start-time shifts). The investment that demonstrably moves the fatality line is engineering controls.
For heat exposure, engineering controls means infrastructure that physically removes heat from the worker:
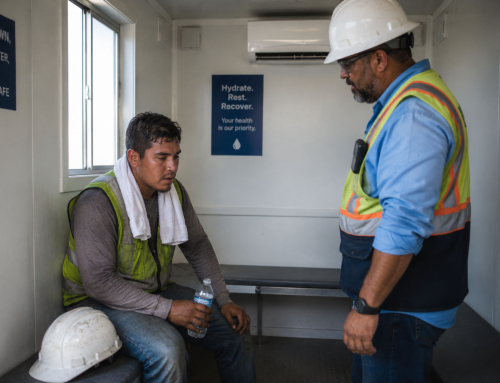
- Mechanical refrigeration. Air-conditioned recovery space large enough to hold a meaningful share of the crew, cool enough (72–74°F interior) to actually drop core body temperature in a 20–30 minute break, and reliable enough to operate through the worst day of the season.
- Redundant cooling capacity. A single-A/C-unit trailer that fails on the hottest day of the year is not a control — it is a single point of failure. Dual-system designs that maintain cooling when one unit goes offline are the difference between continuous protection and intermittent protection.
- WBGT-driven scheduling. Tying work-rest cycles to wet-bulb globe temperature, not to the air-temperature reading on a phone, is the only schedule that reflects the physiological load on the worker.
- Acclimatization protocols. Roughly three-quarters of heat fatalities in OSHA records involve workers in their first week on the job or first week back after time off — a pattern that a structured acclimatization protocol can largely close.12
Why Engineering Controls Are Defensible Investments
Engineering controls do not depend on a tired supervisor enforcing a break, or a paid-by-the-piece worker self-reporting heat symptoms. They reduce the risk at the source. And because they reduce the productivity loss documented above as well as the fatality and incident risk, they tend to pay back faster than safety leaders expect when they first run the math.
8. The Bottom Line for Safety Leaders in 2026
The honest answer to “how many U.S. workers die of heat stress each year” is two numbers, not one. The BLS line item averages 39 per year and is what regulators, journalists, and most internal corporate dashboards report. The actual number, accounting for cause-of-death coding gaps, time-lag deaths, and underreporting, is likely 17 to 50 times higher — somewhere between 600 and 2,000 deaths per year, with substantially more nonfatal heat illness behind every fatality.
The fatalities concentrate in construction, agriculture, oil & gas, postal and delivery, warehousing, refuse collection, mining, utilities, emergency response, and manufacturing. They concentrate geographically in Texas, California, Florida, and Arizona — with California’s lower per-worker rate widely credited to its state heat standard.
The trend line is climbing, not flattening, and OSHA’s enforcement posture in 2026 is the most aggressive it has ever been. The administrative controls OSHA mandates are necessary but insufficient. The interventions that actually reduce the fatality count — mechanical refrigeration, redundant cooling, WBGT-driven scheduling, structured acclimatization — are engineering controls, and they are the layer most U.S. operations have not yet built.
Fewer failures. Fewer fatalities. Lower lifetime cost. Better worker protection.
For a fuller treatment of the engineering side — including a 90-page playbook with WBGT-driven work-rest tables, ROI worksheets, and pre-season checklists — see the Time on Tool guide.
References
- U.S. Bureau of Labor Statistics, Census of Fatal Occupational Injuries (CFOI), 2014–2023 reference years. https://www.bls.gov/iif/oshcfoi1.htm
- U.S. Bureau of Labor Statistics, National Census of Fatal Occupational Injuries in 2023, news release December 2025.
- Public Citizen, Extreme Heat and Unprotected Workers, 2021. Estimates of true U.S. occupational heat-related mortality. https://www.citizen.org/article/extreme-heat-and-unprotected-workers/
- McGuire et al., “Occupational Heat-Related Mortality in the United States: Surveillance Limitations and Estimation Approaches,” peer-reviewed analyses 2018–2024.
- U.S. Bureau of Labor Statistics, Survey of Occupational Injuries and Illnesses (SOII), nonfatal heat-related cases requiring days away from work, 2011–2020.
- National Institute for Occupational Safety and Health (NIOSH), Criteria for a Recommended Standard: Occupational Exposure to Heat and Hot Environments, Publication No. 2016-106. https://www.cdc.gov/niosh/docs/2016-106/
- Climaterig.com, Heat Stress Mitigation for Oil & Gas: Industry-Specific Solutions.
- U.S. Department of Labor, OSHA, Heat-Related Hazards National Emphasis Program (CPL 03-00-024 and successor directives), 2022–2026 enforcement summaries.
- Atlantic Council Adrienne Arsht-Rockefeller Foundation Resilience Center, Extreme Heat: The Economic and Social Consequences for the United States, 2021.
- Vicedo-Cabrera et al., The Lancet Planetary Health, on labor productivity loss from heat exposure.
- National Institute for Occupational Safety and Health (NIOSH), Hierarchy of Controls. https://www.cdc.gov/niosh/topics/hierarchy/default.html
- OSHA, Heat Illness Prevention — Acclimatization; Climaterig.com, Heat Acclimatization for Workers: The Science-Backed Protocol.
Related reading on ClimateRig.com:
- Heat Stress vs. Heat Exhaustion vs. Heat Stroke: Know the Difference
- OSHA Work/Rest Cycles in Heat: What Employers Must Know
- Cool-Down Trailers: What They Are, How They Work, and Why You Need One
- ClimateRig: Built to Outlast Your Longest Projects
- OSHA Heat Regulations 2026: What Changed & How to Comply
About the author : Bryce Hinckley