How ClimateRig Increases Worker Productivity (Not Just Worker Safety)
1. The Number Most Heat Programs Ignore
Every heat-program discussion centers on the same talking point: protect your workers. Real, important, non-negotiable.
What that discussion almost never includes is the second number — the one that gets every CFO’s attention once it’s on the page.
Worker output decreases measurably with each degree of heat exposure above the optimal performance range. Published occupational physiology research (NIOSH, ISO 7243, multiple field studies in construction and agriculture) puts the productivity decay curve in the range of 2 to 3 percent per °C above roughly 25 to 27°C wet bulb globe temperature. By WBGT 32°C (90°F), worker output has dropped meaningfully — even before any worker reports feeling unwell.
By the time a worker self-reports symptoms, you have already lost hours of effective output across the crew. The incident is the visible failure. The productivity decay is the invisible one, and it is much larger.
This article is about the invisible loss — and how engineered recovery infrastructure recovers it.
2. What Happens to Output Above WBGT 86°F
The decay curve is not linear past a threshold. Three things happen at once as WBGT climbs above 86°F (the standard “moderate work-rest” trigger):
- Physical output drops. Workers move slower, lift less, and take more micro-breaks. The pace decay is observable on time-on-tool data without anyone explicitly resting.
- Decision quality drops. Heat-induced cognitive fatigue measurably reduces problem-solving accuracy, situational awareness, and safety-protocol compliance. Construction near-misses and craft-error rates climb with WBGT.
- Crew coordination drops. Communication frequency and clarity both degrade. Foremen report having to repeat instructions more, and rework on heat-affected days runs measurably higher.
The combined effect is larger than any single mechanism. A crew at WBGT 90°F is not just slower. It is slower, less accurate, and less coordinated — across every task, all shift.
3. The Compounding Math of Mandatory Heat Breaks
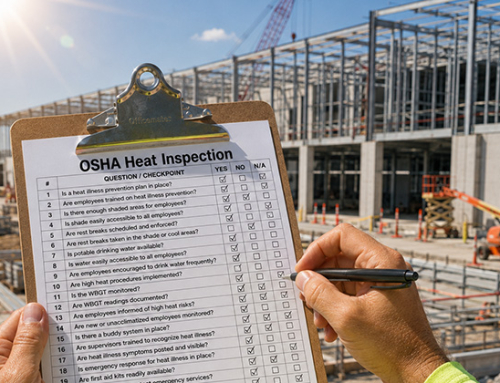
Cal/OSHA §3395 mandates a 10-minute cool-down rest every two hours in high-heat industries. Other state standards and the proposed federal rule are converging on similar work-rest cycles.
The math compounds fast on a sustained project. A 15-worker crew on a 14-day refinery turnaround in Gulf Coast summer:
- 4 mandatory rest cycles per worker per day
- 10 minutes per cycle
- 15 workers
- 14 days
- = 140 hours of mandatory rest time across the crew
That is the floor. Add the additional informal rest workers take when they are overheated (and they do, regardless of policy), and the actual non-productive time on a hot project runs higher.
The question is not whether your crew rests. It is whether they rest in a way that actually restores capacity — or whether they rest in a tarp at 92°F and come back to the work face nearly as hot as when they left.
4. Recovery Time vs. Restoration Time
Most heat programs measure rest as time elapsed. The correct measure is restoration — has the worker’s core temperature, heart rate, and physiological readiness returned to a productive baseline?
A 10-minute break in a 92°F tarp shade structure provides minimal core-temperature reduction. The worker has technically rested. They have not restored.
A 10-minute break in a 72°F air-conditioned environment produces measurable core-temperature reduction, heart-rate recovery, and cognitive reset. Same 10 minutes. Vastly different output capacity on return to the work face.
The difference between recovery and restoration is the difference between a heat program that satisfies the regulation and one that actually keeps workers productive.
5. How 30,000 BTU + 72°F Recovery Resets the Curve
A ClimateRig™ trailer is specified for this exact job:
- Dual 15,000 BTU air conditioners (30,000 BTU total cooling capacity)
- 125 sq. ft. interior sized for 18 workers per recovery cycle
- Sub-75°F interior air, with operating target around 72°F
- Half-ton towable at 2,400 lbs, repositionable in minutes
- Full-length benches so workers actually sit during recovery (standing in shade does not produce the same physiological reset)
The combination produces a documented restoration environment — not just a compliant rest space. Workers entering at elevated core temperature and heart rate leave with both measurably reduced. They return to the work face with capacity restored.
The capacity-restoration math is the productivity argument. The compliance argument is the floor.
6. Placement Matters More Than Capacity
A trailer parked 400 feet from the work face is functionally a trailer that serves half the cycle. Workers count the walk time against their break, take shorter recovery, and accept a worse restoration.
A trailer parked at the leading edge of the work zone — and repositioned as the work moves — is functionally a different piece of equipment. Same hardware. Different outcome.
The mature paving, refining, and solar EPC operators in 2026 treat the trailer’s placement as a daily planning input, not a one-time site decision. The 125 sq. ft. footprint and half-ton towable spec make daily repositioning realistic.
This is the difference between buying a piece of capital equipment and operating it correctly.
7. Three Scenarios Where the Productivity Math Plays Out
The productivity-recovery effect is grounded in published occupational physiology — when workers reach a controlled recovery environment, core temperature and heart rate drop measurably, and the output capacity that heat takes away is restored on return to the work face. The mechanism applies wherever sustained heat exposure is the binding constraint on a crew. Three scenarios worth modeling against your own operation:
- A Gulf Coast refining turnaround. A crew working hours 6–10 of a 12-hour shift sits in the steepest segment of the WBGT productivity decay curve. Inserting a 72°F restoration environment at the leading edge of each work zone — rather than at the central laydown yard — restores capacity entering the second half of the shift. Even a one-to-two-percent productivity improvement across 14 days × 15 workers compounds into a real recovered-hours figure.
- A multi-state agricultural harvest line. Crews working pieceworked harvest rates in open sun show the classic mid-afternoon production trough — the same physiology that drives the regulatory work-rest cycles. Mobile recovery parked at the harvest line, rather than at the equipment trailer, addresses the trough where it occurs. The published literature on heat exposure and agricultural labor productivity makes this directly modelable.
- A construction EPC with trades rotating through hot work zones. When the recovery environment is shared across trades and parked in the staging area at the active work zone, two metrics tend to move together: incident exposure and schedule variance. The physiological constraint is the same in both cases, which is why the same engineering control affects both.
The point is not a specific case study. The point is that the productivity-recovery math is rooted in the same physiology that drives the regulatory work-rest cycles — and the engineering control that satisfies the regulation also closes the productivity gap. Model it against your own crew size, climate, and shift length.
8. The ROI Calculation That Actually Closes
The CFO conversation needs three numbers:
- Trailer capital cost, after Section 179 / bonus depreciation treatment — typically lands in the $35K to $40K range after-tax
- Productivity recovered, even at a conservative 2 percent of crew hours across a hot-weather season — runs into five figures for a 15-worker crew over a single summer
- Heat-incident exposure avoided, including workers’ comp claim cost, OSHA citation risk, and the disruption cost of a single incident — typically multiples of the trailer’s capital cost on a single event
The ROI calculation closes before you account for the regulatory or insurance benefit. The productivity argument alone justifies the capital. The safety case is the secondary win — important and non-negotiable, but no longer the financial driver.
For the full TCO model, see Cool-Down Trailer Rental vs. Ownership: A Total-Cost-of-Ownership Breakdown.
9. The Bottom Line
- Heat exposure cuts worker output measurably per degree above optimal — and the decay starts well before any worker reports feeling unwell
- Mandatory heat breaks compound to 100+ hours per crew on a sustained hot-weather project
- A 10-minute rest in a 92°F tarp is recovery; a 10-minute rest in 72°F engineered cooling is restoration
- ClimateRig’s 30,000 BTU, 18-worker, 72°F engineered recovery environment is built specifically for the restoration job
- Placement matters as much as capacity — the trailer needs to travel with the work face
- The productivity ROI closes the financial case before the safety case is invoked
A complete heat program isn’t just about preventing incidents. It’s about restoring the capacity heat takes away. The first job protects the worker. The second job protects the schedule.
Related reading on ClimateRig.com:
- Cool-Down Trailer Rental vs. Ownership: A Total-Cost-of-Ownership Breakdown
- ClimateRig™: Built to Outlast Your Longest Projects
- OSHA Work/Rest Cycles in Heat: What Employers Must Know
- The Hydration Math
- Personal Cooling Vests vs. Cool-Down Trailers
- Heat Acclimatization for Workers: The Science-Backed Protocol
Want a worked productivity-ROI model with your own crew size, climate, and project length? Visit atspro.co/BPX-Productivity or call 800.747.9953 for a 15-minute productivity-and-safety ROI walkthrough.
About the author : Bryce Hinckley